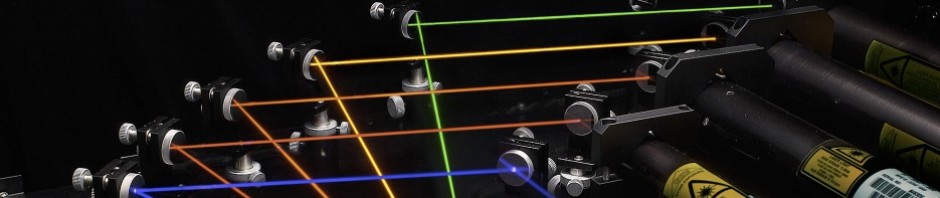
- Overview
VectMAP is software for simultaneously mapping two-dimensional distribution information of quantities with the magnitude and orientation of vector quantities, such as birefringence, electromagnetic fields, and fluids.-
- Color/grayscale stratified display
- Contour line display
- Azimuth display with slope of line segments
- 3D bird’s eye view display
By using a combination of functions such as the following, a variety of expressions become possible. For example, if the size of the vector is expressed by the brightness of the display and the orientation of the main axis by the tint of the display, the 2D distribution can be displayed in high density. Therefore, the display does not become crowded and difficult to distinguish when the data is dense, as in the conventional display method using arrows.
-
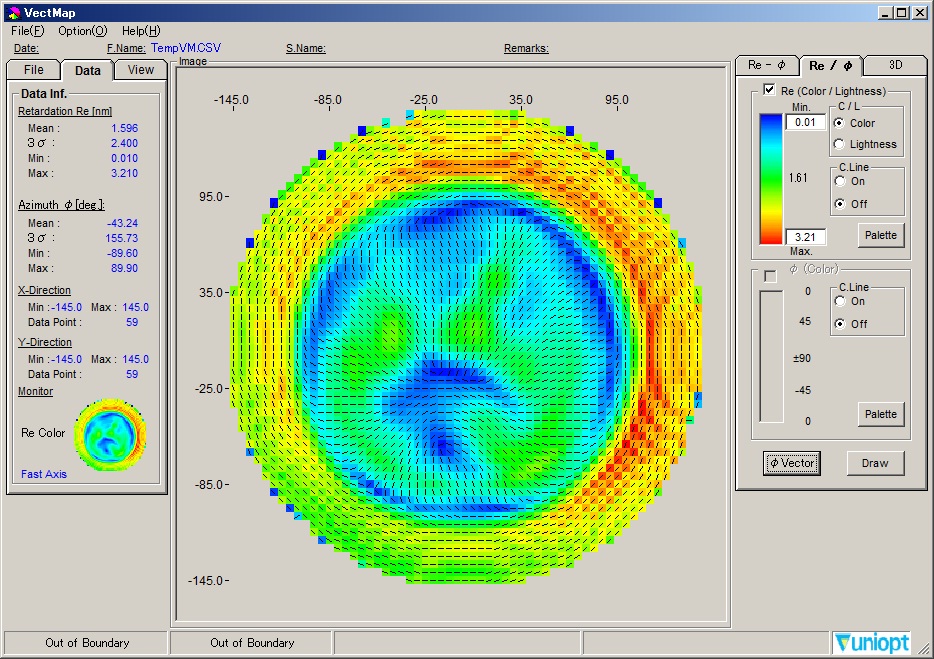
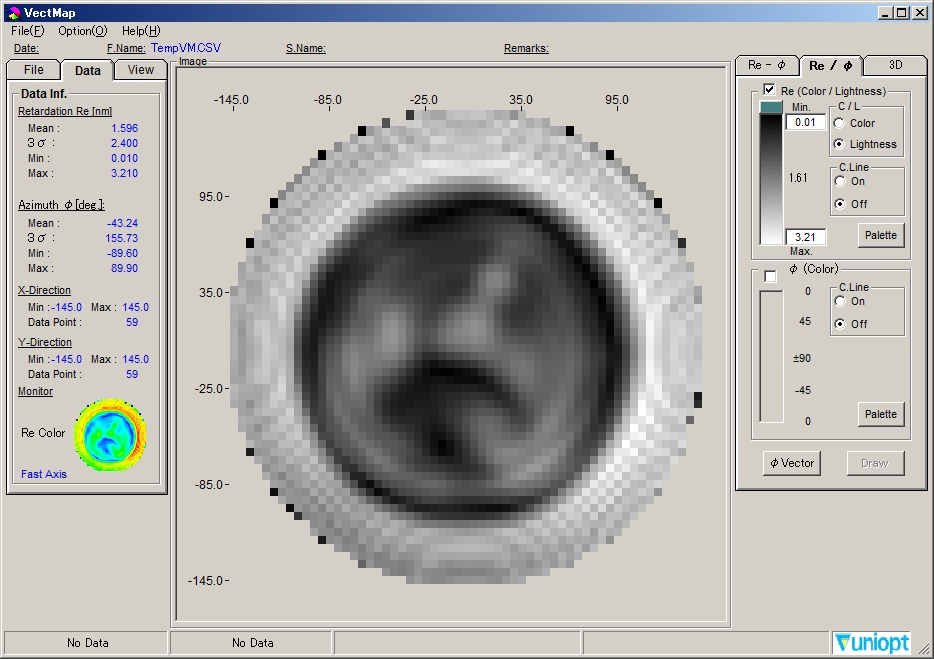
- Display example
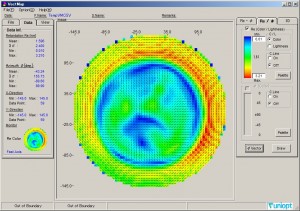
Color scale of birefringence phase difference and line display of principal axis orientation
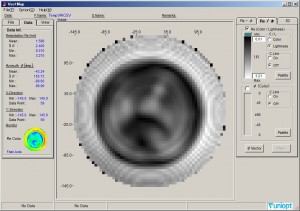
Gray scale display of birefringent phase difference
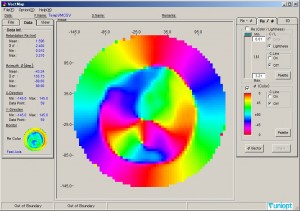
Color scale display of principal axis orientation
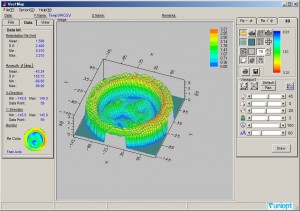
Bird’s eye view of birefringence phase difference
(Any cross section can be displayed from this screen)
- Price
List Price : ¥150,000-


Language
-
Recent Posts
Archives
- April 2025
- December 2024
- July 2024
- March 2024
- November 2023
- August 2023
- March 2023
- December 2022
- July 2022
- May 2022
- December 2021
- August 2021
- April 2021
- December 2020
- August 2020
- February 2020
- December 2019
- October 2019
- September 2019
- August 2019
- January 2019
- December 2018
- August 2018
- July 2018
- March 2018
- December 2017
- August 2017
- July 2017
- March 2017
- February 2016
- December 2015
- July 2015
- June 2015
- January 2015
- November 2014
- October 2014
- August 2014
- June 2014