-
Change over time
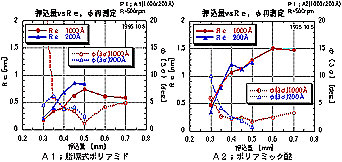
Finally, we show the results of measurements of the birefringence of the rubbed film over time. Exactly the same measurements were made immediately after the rubbing and one month later. The following four graphs show the changes. The horizontal axis shows the amount of indentation, and the vertical axis shows the average value of retardation. It can be seen that the retardation axis orientation tends to change when the amount of indentation is small.
- Concluding Remarks
This is a brief introduction to the measurement of rubbing films. In this experiment, we did not go into the condition of the display. If you have any requests, we would be happy to discuss them with you.


