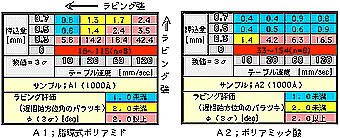
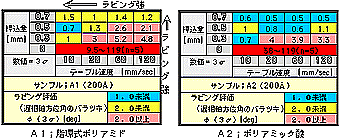
- Evaluation by standard deviation of slow-phase axis orientation Φ(3σ)
The following four tables summarize the relationship between the rubbing strength and the standard deviation Φ of the (birefringent principal axis) slow axis orientation. In order to make the tables intuitive and easy to understand, we have divided the values of Φ into three groups and displayed them in different colors. Blue is less than 1.0, yellow is 1.0-2.0, and red is greater than 2.0.
The next page shows a summary of the “waviness” of the retardation.


